Estimation of a multivariate von Mises distribution for contaminated torus data
-
Free University of Bozen-Bolzano, Italy [giulia.bertagnolli@unibz.it]
-
University G. Fortunato, Benevento, Italy [l.greco@unifortunato.eu]
-
University of Trento, Trento, Italy [claudio.agostinelli@unitn.i]
Keywords: Weighted likelihood – Circular data – ICORS – Robustness
1 Contamination in circular data
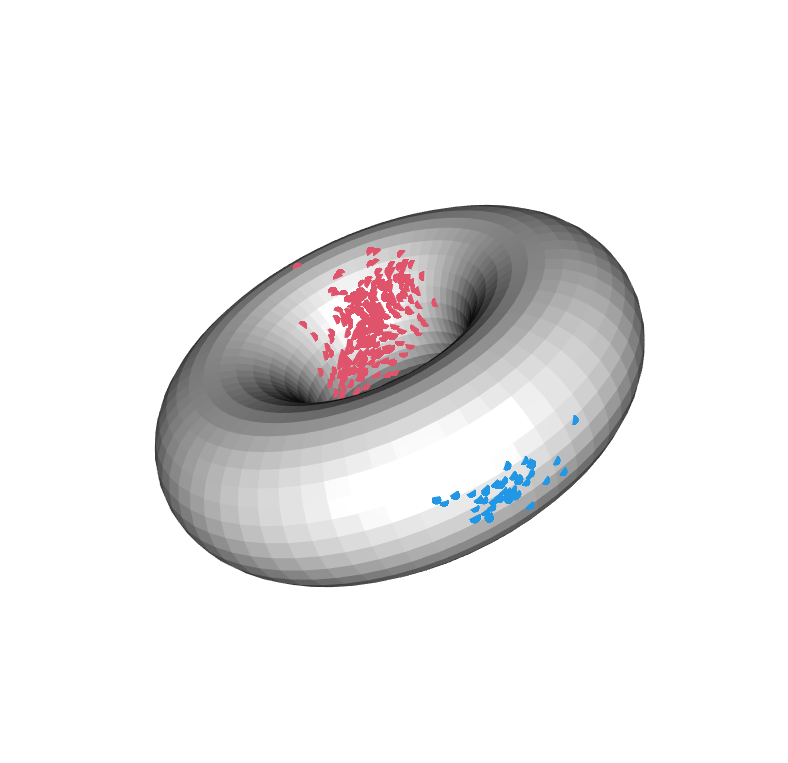
Observations of wind directions, arm movements and other angles measurements, but also time data over the 24 hours (0:00 corresponding to and 24:00 to ), due to their periodicity, can be thought and modelled as circular data, that is, points on the surface of a torus. Its particular topology requires careful adaptation of classical linear statistical methods for the analysis of observations on its surface, as well as specific families of distributions to model them. The von Mises distribution is a well-known distribution for circular data. The variate density of the von Mises sine distribution is
| (1) |
where is a variate circular random variable, is the location vector, , with , is the concentration vector, and for [Mardia et al., 2008]. The normalising constant cannot be expressed in closed form for , so we make the usual assumption that the concentration values are sufficiently large, and that the matrix , defined as , is positive definite. In this case, the density in eq. (1) can be approximated by the concentrated multivariate sine distribution (CMS) of Mardia et al. [2012]
 |
 |
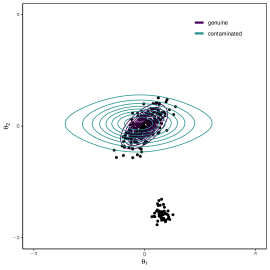
Of course, circular data are not exempt from contaminations, which can very badly affect MLE-based inference. Figure 1 shows, in the left panel, a sample of 250 observations from a bivariate von Mises distribution, which has been contaminated with 50 outliers. The contours superimposed on the scatter plot in the right plane highlight how the contaminated estimates differ from the original parameter values. The weighted likelihood methodology [Lindsay, 1994, Markatou et al., 1998] has been proved both efficient and effective for robust estimation, and has been recently applied also to univariate [Agostinelli, 2007] and multivariate [Greco et al., 2021, Saraceno et al., 2021, Agostinelli et al., 2024] circular data. However, the study of the variate von Mises distribution is still missing. In [Bertagnolli et al., 2024], we fill this gap.
1.1 Weighted likelihood estimating equations
Intuitively, robustness is achieved by down-weighting, in the score estimating equation, those observations that are unlikely w.r.t. the assumed model. Let us assume , and denote by the parameters of interest, by the assumed CMS model, by the corresponding score, by the empirical distribution function of a random sample, and by a non-parametric kernel estimate of the true unknown density of . The agreement of the th observation with the assumed model is quantified through its Pearson residual:
| (2) |
indicates perfect agreement with the model, while values away from zero label as an out-lier, , or in-lier, . To guarantee that the Pearson residuals converge to 0 with probability 1 when the model is correct, the model is also smoothed through the same kernel of , that is . The WL estimating equation (WLEE) then reads
| (3) |
where is a so-called residual adjustment function (RAF), whose aim is to down-weight observations with large or negative residuals, but which also provides a direct link with disparity minimisation and the robustness properties of the derived estimator [Lindsay, 1994]. We use a symmetric chi-square (SCHI) RAF.
2 Results
 |
 |
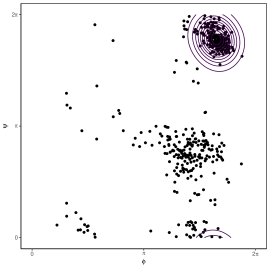
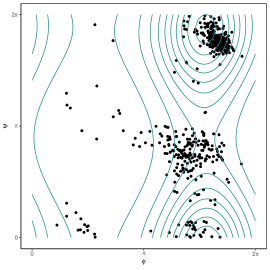
The proposed technique proves satisfactory both on synthetic and real data examples. Figure 2 shows results of estimation based on WL (left) and ML (right) for the well-known protein 8TIM bivariate data, concerning backbone torsion angle pairs [Chakraborty and Wong, 2021]. This dataset has multiple clusters, which are not detected by MLE. The WL methodology, instead, gives strong indications of the presence of such sub-structures, which can be unveiled by further inspection of the multiple roots of the WLEE.
References
- Agostinelli [2007] C. Agostinelli. Robust estimation for circular data. Computational Statistics & Data Analysis, 51(12):5867–5875, 2007.
- Agostinelli et al. [2024] C. Agostinelli, L. Greco, and G. Saraceno. Weighted likelihood methods for robust fitting of wrapped models for p-torus data. AStA Advances in Statistical Analysis, pages 1–36, 2024.
- Bertagnolli et al. [2024] G. Bertagnolli, L. Greco, and C. Agostinelli. Estimation of a multivariate von mises distribution for contaminated torus data, 2024.
- Chakraborty and Wong [2021] S. Chakraborty and S. W. K. Wong. BAMBI: An R package for fitting bivariate angular mixture models. Journal of Statistical Software, 99(11):1–69, 2021.
- Greco et al. [2021] L. Greco, G. Saraceno, and C. Agostinelli. Robust fitting of a wrapped normal model to multivariate circular data and outlier detection. Stats, 4(2):454–471, 2021.
- Lindsay [1994] B. G. Lindsay. Efficiency versus robustness: The case for minimum hellinger distance and related methods. The Annals of Statistics, 22:1018–1114, 1994. doi: 10.1214/aos/1176325512.
- Mardia et al. [2008] K. V. Mardia, G. Hughes, C. C. Taylor, and H. Singh. A multivariate von mises distribution with applications to bioinformatics. The Canadian Journal of Statistics, 1:99–109, 2008.
- Mardia et al. [2012] K. V. Mardia, J. T. Kent, Z. Zhang, C. C. Taylor, and T. Hamelryck. Mixtures of concentrated multivariate sine distributions with applications to bioinformatics. Journal of Applied Statistics, 39(11):2475–2492, 2012.
- Markatou et al. [1998] M. Markatou, A. Basu, and B. G. Lindsay. Weighted likelihood equations with bootstrap root search. Journal of the American Statistical Association, 93(442):740–750, 1998. doi: 10.2307/2670124.
- Saraceno et al. [2021] G. Saraceno, C. Agostinelli, and L. Greco. Robust estimation for multivariate wrapped models. Metron, 79(2):225–240, 2021.