A hacking day of Mathematics for Data Science at the Department of Mathematics
 |
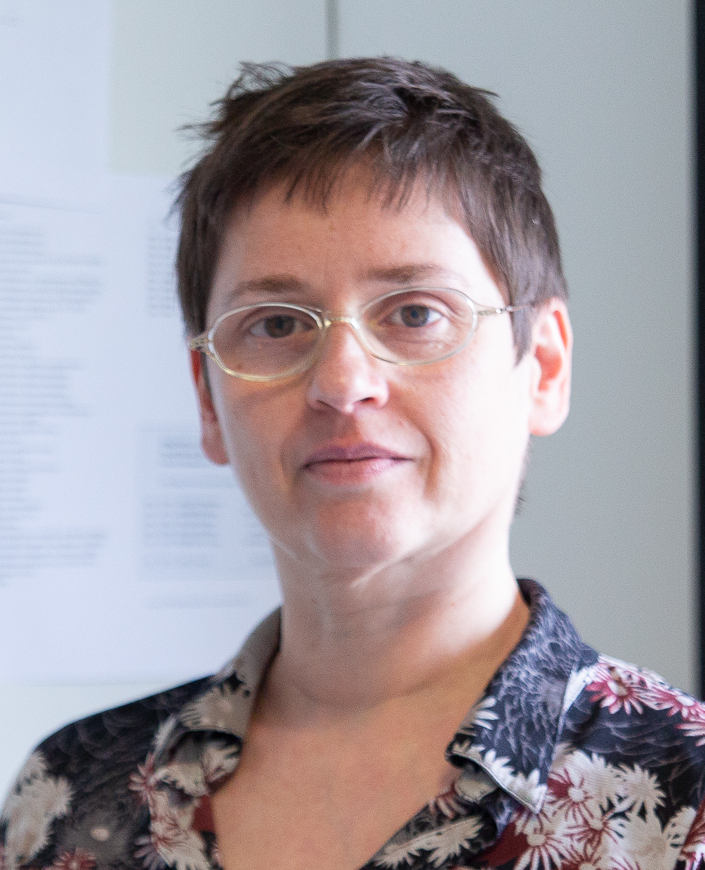
Eva Riccomagno |
| (Department of Mathematics - University of Genova) |
| website |
|
Bio
Eva Riccomagno is a graduate of BS in Mathematics at the University of Genova where she is an Associate Professor in Statistics since 2007. She worked many years at the Department of Statistics, The University of Warwick, where she obtained her PhD degree discussing the first thesis in Algebraic Statistics in 1998. Her other research interests include design and analysis of experiments, mathematical and algebraic statistics, probabilistic graphical models and symbolic methods in Stochastics.
 |
Federico Carli |
| (Department of Mathematics - University of Genova) |
| website |
|
Bio
Federico Carli is a second year PhD student in *Mathematics and Applications* at the Department of Mathematics at the University of Genoa, sponsored by the insurance company Swiss Re and it is focused on Graphical Models. He holds a Bachelor Degree in Statistics, Mathematics and Data Management at the University of Genoa and a Master Degree in "Statistics" at the University of Padua.
Syllabus
The course is an introduction to statistical models supported on finite graphs. The idea of modelling a complex system with a graph is present in various disciplines, from information theory to systems engineering to machine learning. In statistics a graphical model specifies conditional independence statements between random vectors, thus providing a statistical model for the joint distribution of observed variables. The graph has the advantage of providing a visual representation and is a powerful calculation tool. The course presents the basics of probabilistic graphical models, including their algebraic representations and basic software.
References
- Søren Højsgaard David Edwards Steffen Lauritzen (2012). Graphical Models with R. Springer
- Steffen Lauritzen (1996). Graphical models. Clarendon Press Oxford
Software requirements
During the seminars there would be also a computer session using R. Please install it and run the following code in order to be ready for the class.
source("http://bioconductor.org/biocLite.R")

biocLite("graph")
biocLite("RBGL")
biocLite("Rgraphviz")
biocLite("gRim")
biocLite("gRbase")
biocLite("lcd")

library(graph)
library(RBGL)
library(Rgraphviz)
library(gRim)
library(gRbase)
library(igraph)

install.packages("bnlearn")
install.packages("ggm")
install.packages("qgraph")

library(bnlearn)
library(ggm)
library(qgraph)
Schedule
- 28 January 2019, 14:00-18:00 @ A219 Povo 1
- 29 January 2019, 09:00-13:00 @ A219 Povo 1
Details
- Poster: PDF
- The participation is free. Please send an email to Prof. Claudio Agostinelli.
- For further information, please contact Prof. Claudio Agostinelli
- Venue: Polo Scientifico e Tecnologico F. Ferrari – Room A219
- Language: English
Material (Restricted access, user: GM2019)

